# Observations
With Enginsight, all devices can be checked for availability via ping or port check and monitored via SNMP, even without an agent. The prerequisite for this is the installation of a '[Watchdog](https://docs.enginsight.com/docs/master/operation/discoveries#watchdogs)'.
{% hint style="warning" %}
Keep the Watchdog software component up to date and [perform updates regularly](https://docs.enginsight.com/docs/master/operation/discoveries#update-watchdog).
{% endhint %}
Learn in the following how to monitor devices via SNMP and set up ping and port monitoring with Enginsight.
## SNMP
SNMP allows you to include those devices in the monitoring with Enginsight, on which no [Pulsar agent](https://docs.enginsight.com/docs/master/operation/legacy/hosts-agent-pulsar#enginsight-pulsar-agent) can be installed. The most important areas of use for SNMP are the monitoring of switches, printers and industrial equipment. First install a [watchdog](https://docs.enginsight.com/docs/master/operation/discoveries#watchdogs) in the network, which takes over the IP monitoring.
### Sensors
Add devices as SNMP sensors to monitor them with Enginsight.
#### Add SNMP sensor
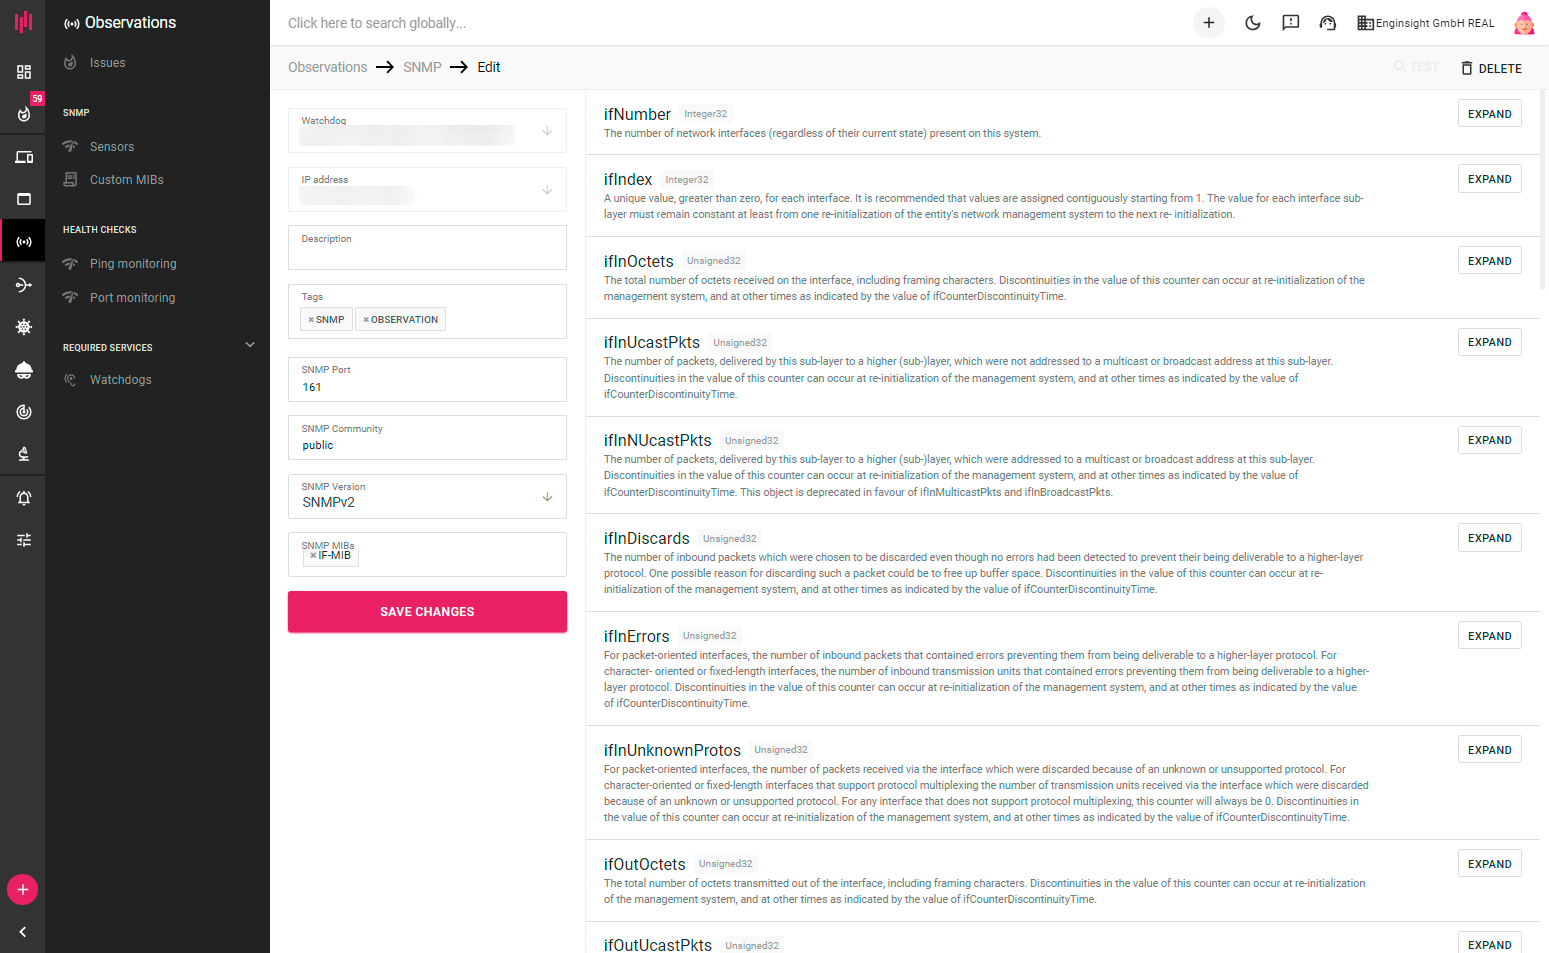
1. Select a watchdog that has access to the device and the IP address of the SNMP-enabled device.
2. If necessary, assign a description and tags.
{% hint style="info" %}
It is recommended to group your sensors with tags to effectively manage alarms.
{% endhint %}
3. Specify the SNMP port that is defined on the device. The default setting is port 161.
4. Select the supported SNMP version. \
SNMPv1/SNMPv2: Select the SNMP community string. This is usually "public". \
SNMPv2/SNMPv3: Select user name, encryption password, encryption protocol, authentication password, and authentication protocol.
{% hint style="info" %}
While first- and second-generation SNMP come without authentication and encryption procedures, this security shortcoming is remedied in SNMPv3.
{% endhint %}
5. Select the appropriate Management Information Base (MIB).
{% hint style="info" %}
The data values that can be monitored are described in a MIB. It is a kind of specific address directory for the respective device. Standards exist for SNMP, but potentially every manufacturer can make their own definitions and offer MIBs for their devices.
The MIBs supplied with Enginsight are based on the specifications of the Internet Assigned Numbers Authority (IANA) and the Internet Engineering Task Force (IETF). This means that a large number of devices can already be monitored via SNMP. You can find out which MIB can be used for the respective device from the manufacturer, for example via the device's webapp. If the manufacturer uses a MIB that differs from IANA and IETF, you can [upload](#own-mibs) it.
{% endhint %}
6. Before you create the sensor, you can test it. Click Test and select the desired values (OIDs: Object Identifier) to be monitored. Optionally, you can define [expected values](#define-expected-values-and-set-alert) afterwards. Add the SNMP sensor and the monitoring starts.
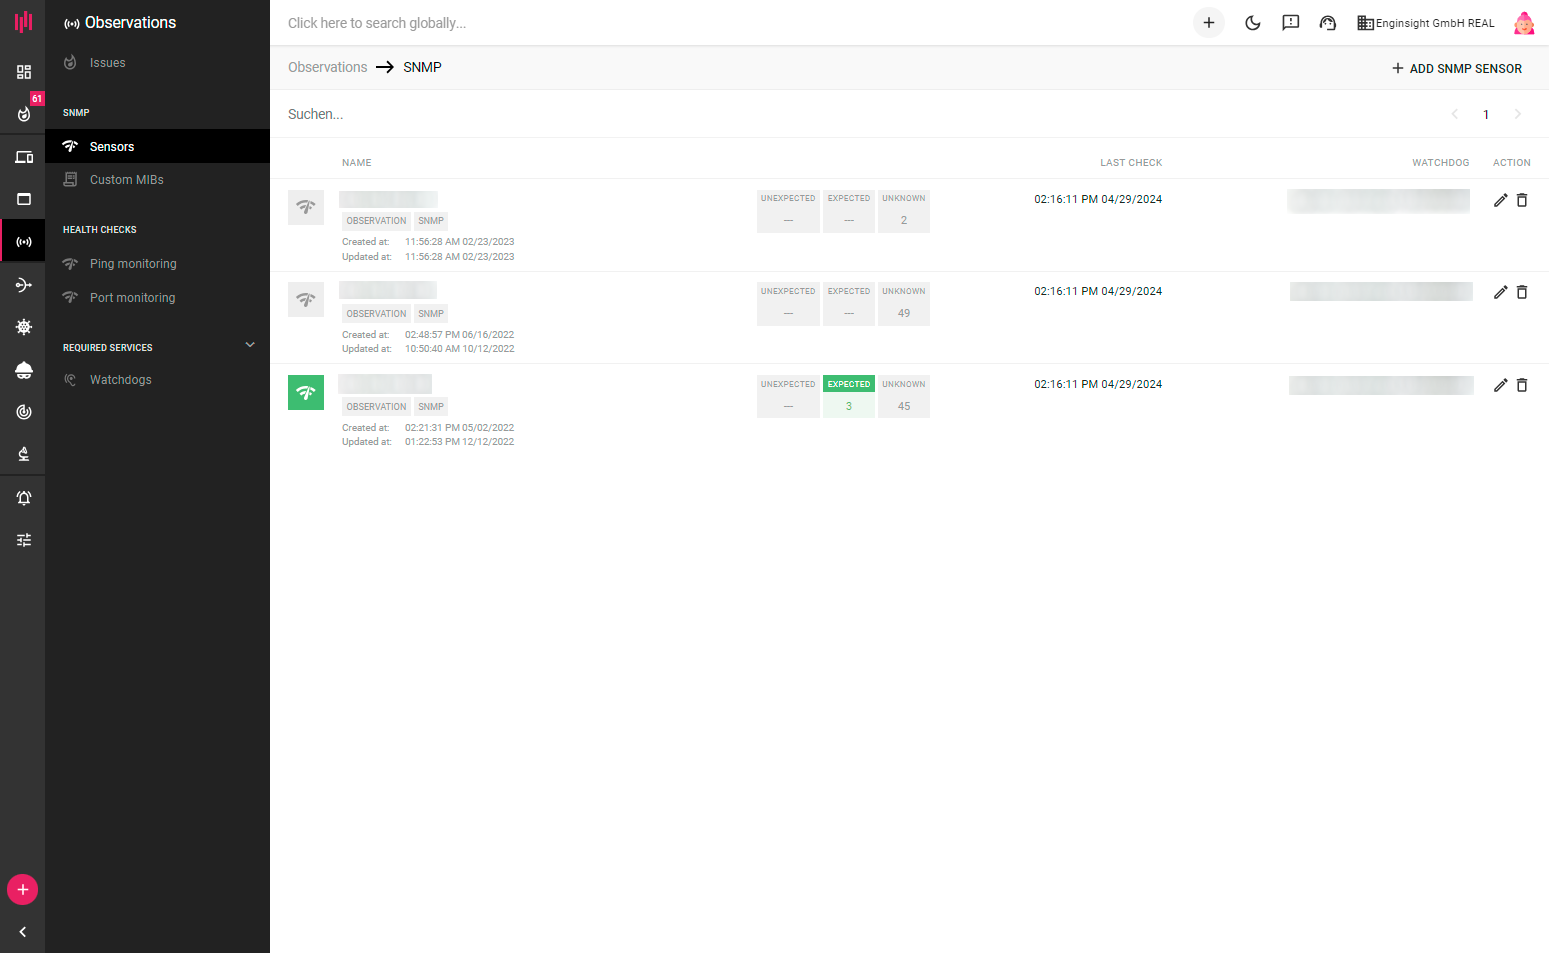
#### Define expected values and set alert
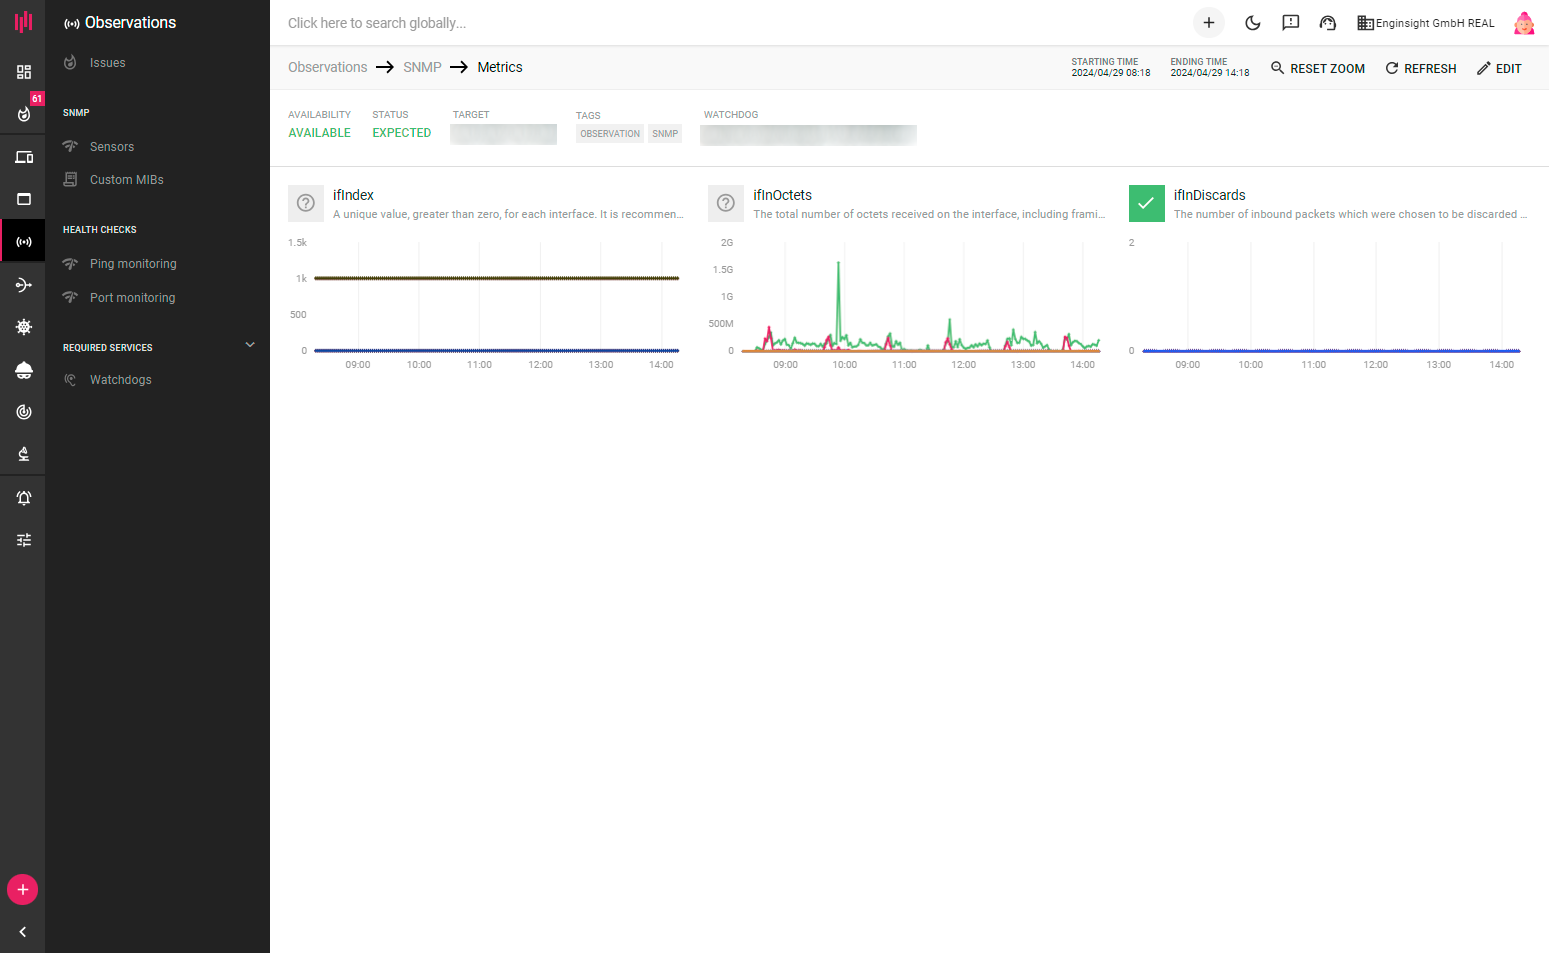
By defining expectation values for individual values (OID: Object Identifier) of SNMP monitoring, you can see at a glance whether your SNMP devices are in the desired state or whether there are problems. You can define expected values for a status (e.g. up) or also expected values for metrics (e.g. 1000 to 3000).
In the overview of all SNMP sensors you can already see if there are unexpected SNMP statuses. If all values are in the defined range, the sensor receives a green status.
To be immediately informed about deviating values, use the alert **"Deviating SNMP status"**.
{% hint style="info" %}
In most cases it is useful to group the SNMP sensors with tags and switch the alert to the corresponding tags.
{% endhint %}
### Own MIBs
If your SNMP device does not support any of the supplied MIBs, you can upload your own MIB. You can get this from the manufacturer of the corresponding device. Simply upload the MIB file to the Enginsight platform.
{% hint style="danger" %}
**Please note that the Watchdog software component must be restarted in order to use a newly uploaded MIB.**
To do this, run the `service ngs-watchdog restart` command in the console of your Linux VM or appliance on which the watchdog is installed.
{% endhint %}
## Health Checks
Health Checks are IP address based checks of observations. These are, for example, local devices that have been detected by the Watchdog or transferred to the Enginsight platform via IP itself. On the other hand, these can also be websites, which you can easily add via IP address.
### Ping Monitoring
Ping monitoring is your means of checking the accessibility of your target systems and measuring network availability. This involves checking at regular intervals whether a system is generally accessible - regardless of how quickly a website or application responds.
{% hint style="info" %}
Health checks can only be used after the installation of a watchdog. Learn [here](https://docs.enginsight.com/docs/master/operation/discoveries#add-watchdog) how a watchdog can be created.
{% endhint %}
To create a ping monitoring, simply go to 'Observations' → 'Ping Monitoring' and click 'Add Ping Check'. Enter an 'IP address or domain'. Now select the 'Watchdog' that will do the monitoring. Enter a 'Description' and 'Tags'. So fast you have set up a ping monitoring. Enginsight now checks the IP address for availability once every minute. In a diagram you get a clear presentation of the results.
{% hint style="info" %}
Ping monitoring can also be set up directly from 'Asset Discovery'. Under 'Discovery', you will find a corresponding button behind each asset found.
{% endhint %}
### Port-Monitoring
Go to Observations → Port Monitoring and click 'Add Port Check'. After that an input window appears where you first have to enter the 'IP adress or Domain' to be monitored. Then select one of your 'Watchdogs', which should take over the monitoring. After that you can write a 'Description' and set 'Tags'. Finally, select the 'Ports' to be checked. To make the setup easier for you, we have predefined certain standard ports.
{% hint style="info" %}
Health checks can only be used after the installation of a Watchdog. Learn [here](https://docs.enginsight.com/docs/master/operation/discoveries#add-watchdog) how a Watchdog can be created.
{% endhint %}
## Watchdogs
To be able to run ping/port checks as well as SNMP monitoring, you need a watchdog that reaches the corresponding systems. You can find out how to install a watchdog [here](https://docs.enginsight.com/docs/master/operation/discoveries#add-watchdog).