# My Dashboards
## My Dashboards
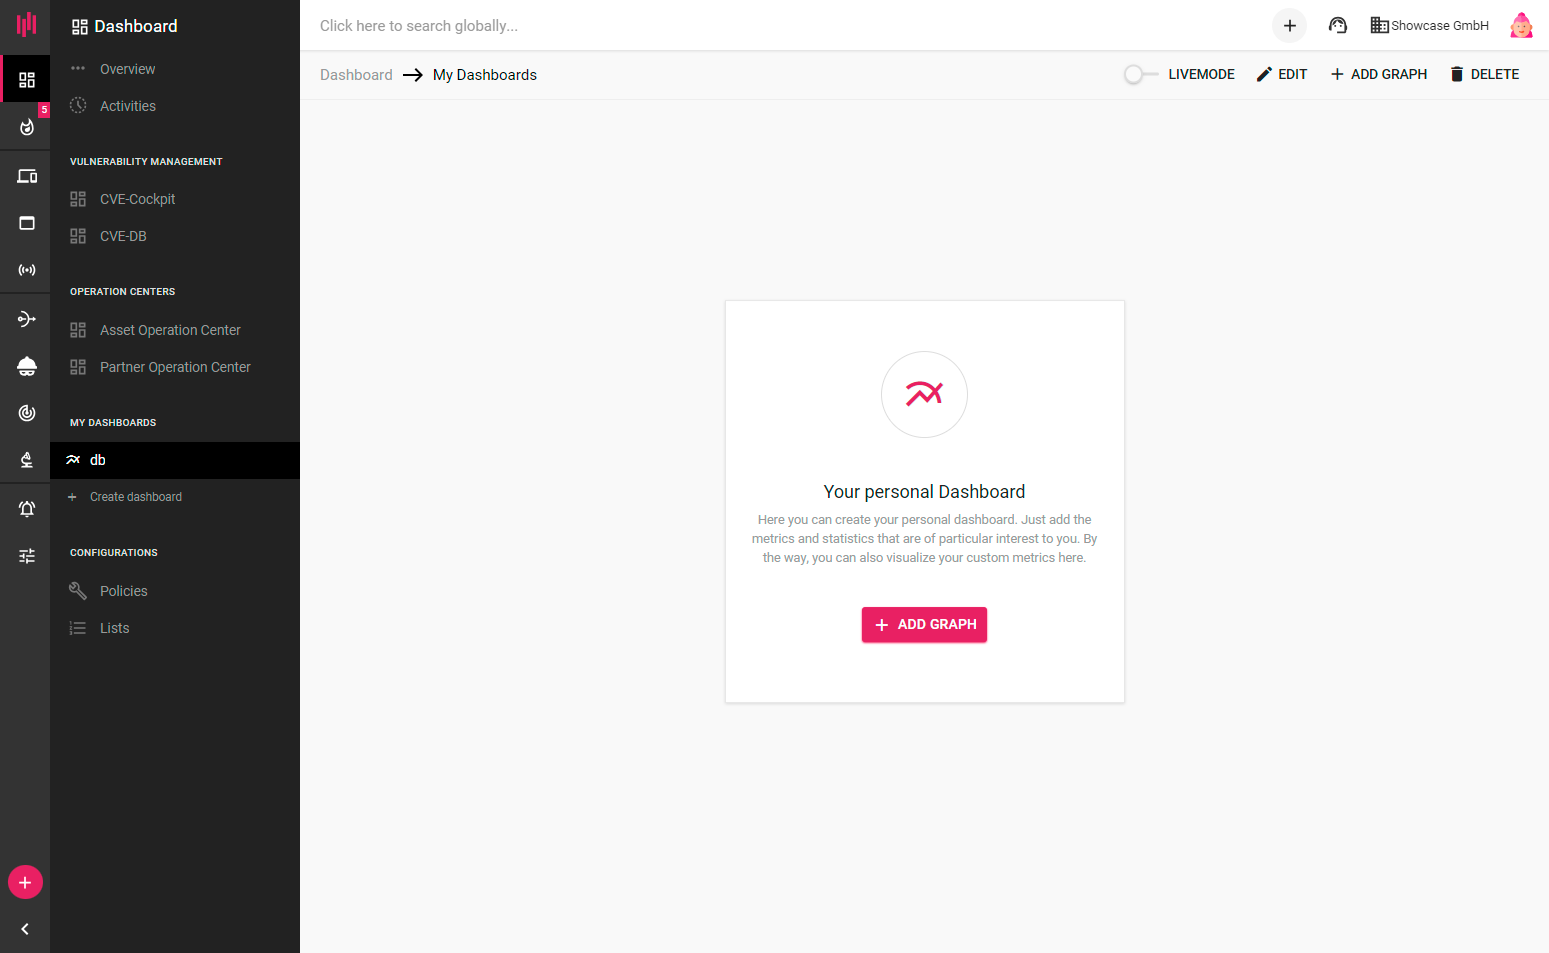
For your individual use of Enginsight we offer 'My Dashboards'. Here you can decide for yourself which informations are relevant to you and create your very own overviews.
### Create an Individual Dashboard
If you have not yet created your own dashboards, you will find 'My Dashboards' as shown in the screenshot above. Just enter a descriptive name and then click on 'Create Dashboard' to create a new dashboard.
Here, for example, we have created a dashboard named "Hosts: CPU Usage". In this dashboard we want to show the CPU utilization of several hosts.
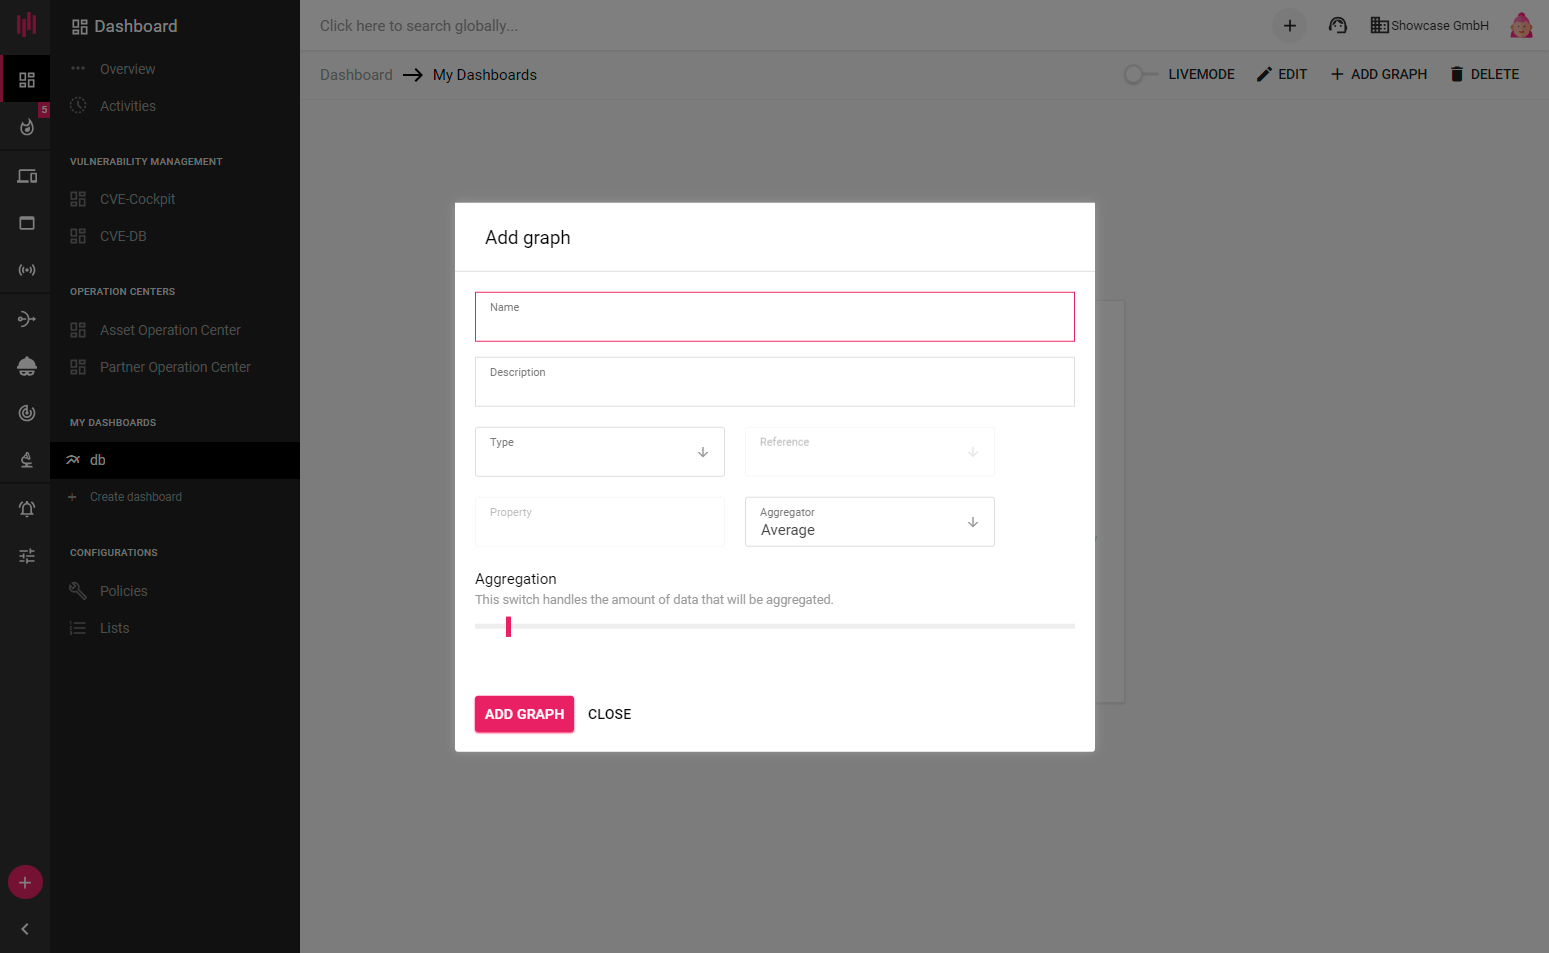
On the left you will now see the newly created dashboard. To fill it with informations simply click on "Add Graph" in the upper right corner or on the information tile.
Now you can create your first graph, which will be displayed in the new dashboard. Of course you can create several graphs per dashboard to get the desired overview.