# Cockpits
Who knows better which information is relevant for your own company than you? Under the menu item Cockpits you have the possibility to create your own dashboards. Customize the views to your needs and choose between numerous overview options the ones that suit you best. Each view in the cockpit is based on a predefined or self-created [event stream](https://docs.enginsight.com/docs/master/operation/platform/data-lake#create-stream). It is also possible to build several different views based on a single stream.
Set a start and end time for viewing within the cockpit. By activating the "Autoreload" button you are sure to always stay up to date. Use the "Full Screen" button to quickly switch to full screen mode to hide distracting details and exit by pressing the escape key.
Via "Add widget" you can quickly create new views and under the "Edit" button you can also edit the name and description of the cockpit afterwards.
## Add Cockpit
To create a new cockpit, click on "Add cockpit" in the upper right corner. In the pop-up window that appears, enter a concise name and a short description and confirm your entries with "Add cockpit".
### Create views
Please refer to the following tabs for the setup of the respective display formats:
{% tabs %}
{% tab title="Line" %}
Determine which information should be displayed on the left x-axis and on the right y-axis. For this purpose, assign a field to the respective axis under "Field name". Define the desired "unit" (Numeric, Bytes, Kilobytes, Megabytes, Miliseconds, Seconds, Minutes) and change the color of the display if necessary. Repeat this for both axes. You can also assign several fields to each axis using the "ADD FIELD" button. If you do not define any fields, the total number of all events of this stream will be displayed automatically!
{% endtab %}
{% tab title="Bar" %}
Corresponds to the setup under "Line".
{% endtab %}
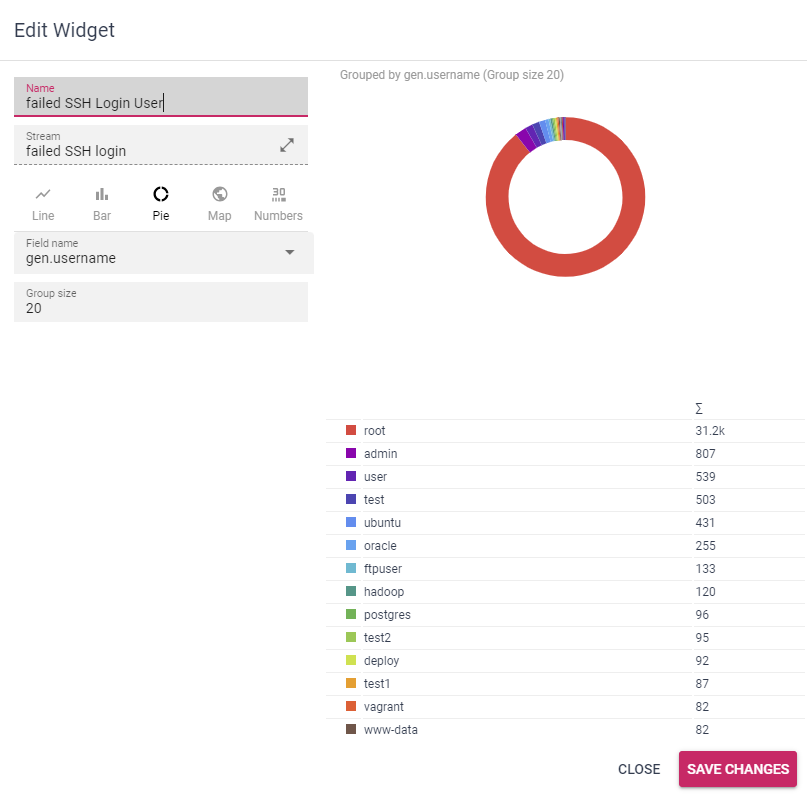
{% tab title="Pie" %}
Assign a specific field from the assigned stream to the plot and thus display the 20 most common results within the chart.
{% endtab %}
{% tab title="Map" %}
Select the "Country" option under "Scale". Now specify a suitable geoip field from your specified stream under "Location Source".
{% endtab %}
{% endtabs %}
Customize the size of the added widget by dragging the bottom right corner. The buttons in the upper right corner allow you to change the position of the widget, change the selected display or delete the widget from the cockpit.