> For the complete documentation index, see [llms.txt](https://docs.enginsight.com/docs/llms.txt). Markdown versions of documentation pages are available by appending `.md` to page URLs; this page is available as [Markdown](https://docs.enginsight.com/docs/manual/english/platform-usage/dashboard/overview.md).

# Overview

The Dashboard provides a visual overview of used and available assets and licenses, as well as existing vulnerabilities, network anomalies, and audit trends.

***

<i class="fa-compass">:compass:</i> Navigate to **Dashboard** → **Overview** to get a centralized view of the most important information within the Enginsight platform.

<figure><img src="https://2423388680-files.gitbook.io/~/files/v0/b/gitbook-x-prod.appspot.com/o/spaces%2FV7OrHgKXA0t1jankQBYf%2Fuploads%2F7u2fpKsrLlbi9l87pDFT%2FEnginsight-EN-Dashboard-Overview-Full.jpg?alt=media&amp;token=6c80f2a0-468e-4433-8ce0-31c26d9b2055" alt=""><figcaption></figcaption></figure>

The [dashboard overview](https://docs.enginsight.com/docs/manual/english/platform-usage/dashboard/overview.md) provides information such as:

* how many licenses are available in total and how many are currently in use.
* which assets and applications are most affected by vulnerabilities.
* how the severity of network anomalies has developed over time.
* what aggregated results can be derived from all penetration tests.

***

## Navigation

### Defining Start and End Date

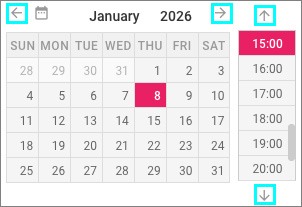
<i class="fa-computer-mouse">:computer-mouse:</i> Click <i class="fa-calendar-days">:calendar-days:</i> **Starting Time** or <i class="fa-calendar-days">:calendar-days:</i> **Ending Time** in the upper-right corner to define the time range for the information shown. The date picker opens.

<div align="left"><figure><img src="https://content.gitbook.com/content/V7OrHgKXA0t1jankQBYf/blobs/PGBGvX31iLdfgH5CY6NL/enginsight-screenshot-dashboard-start_endzeitpunkt.jpg" alt=""><figcaption></figcaption></figure></div>

<i class="fa-computer-mouse">:computer-mouse:</i> Click a date in the calendar view and select a time from the panel on the right to define a specific point in time. Use the arrow buttons to navigate between months or show additional times.

<i class="fa-computer-mouse">:computer-mouse:</i> Click **Reset Zoom** <i class="fa-magnifying-glass-minus">:magnifying-glass-minus:</i> above the dashboard to refresh all information shown and return the view to the current time.

***

## Dashboard: Tiles

The dashboard provides the following information from left to right and from top to bottom:

### General Information

The tiles in this section show general information about your organization as well as links to additional Enginsight resources.

<figure><img src="https://2423388680-files.gitbook.io/~/files/v0/b/gitbook-x-prod.appspot.com/o/spaces%2FV7OrHgKXA0t1jankQBYf%2Fuploads%2F5X5pktEAZyVggnbpOoNT%2FEnginsight-EN-Dashboard-Overview-General%20Information.jpg?alt=media&amp;token=3af61bb0-e625-453f-9308-574bb277a27c" alt=""><figcaption></figcaption></figure>

The following information is shown:

<table><thead><tr><th width="200.39453125">Information</th><th>Description</th></tr></thead><tbody><tr><td>Company</td><td>Shows the name, email address, and postal address of the organization you are currently logged in to.<br><br><i class="fa-computer-mouse">:computer-mouse:</i> Click the <strong>Edit</strong> icon <i class="fa-pencil">:pencil:</i>  in the upper-right corner of the tile to change this information in the <a href="https://docs.enginsight.com/docs/manual/english/administration/settings/organisation.md#organisation-information">settings</a>.</td></tr><tr><td>Related Links</td><td>Shows links to various Enginsight resources, such as the Enginsight Manual and the Knowledge Base.</td></tr></tbody></table>

***

### Assets and Licenses

The pie charts in this section Shows the currently used and available license contingents, broken down into the categories **Hosts (Servers)**, **Hosts (Clients)**, **Endpoints**, and **Observations**.

<figure><img src="https://2423388680-files.gitbook.io/~/files/v0/b/gitbook-x-prod.appspot.com/o/spaces%2FV7OrHgKXA0t1jankQBYf%2Fuploads%2FFUI8kIWHcXVDb2AfsHfr%2FEnginsight-EN-Dashboard-Overview-Licenses.jpg?alt=media&amp;token=3f6fb2be-e52e-45f5-b92d-8f6cff8db2dc" alt=""><figcaption></figcaption></figure>

The following information is shown:

<table><thead><tr><th width="199.8203125">Information</th><th>Description</th></tr></thead><tbody><tr><td>Available</td><td>Shows the total number of licenses available to the organization for the respective category.</td></tr><tr><td>In Use</td><td>Shows the total number of licenses currently being used by the organization for the respective category.</td></tr><tr><td>Active</td><td>Shows the number of licenses in the respective category that are currently active and in use.</td></tr><tr><td>Inactive</td><td>Shows the number of licenses in the respective category that have been assigned but are not currently being used.</td></tr><tr><td>Unknown</td><td>Shows the number of licenses in the respective category whose current status cannot be determined reliably.</td></tr><tr><td>Free</td><td>Shows the number of licenses in the respective category that are still available for use by the organization.</td></tr></tbody></table>

<i class="fa-computer-mouse">:computer-mouse:</i> Click the **Plus** icon <i class="fa-plus">:plus:</i>  in the upper-right corner of a tile to add a [new host](https://docs.enginsight.com/docs/manual/english/installation-and-configuration/installation-and-configuration/enginsight-components/pulsar.md) or a [new endpoint](https://docs.enginsight.com/docs/manual/english/platform-usage/endpoints/overview/add-endpoint.md).

***

### Vulnerabilities

The tiles in this section show various analyses of CVEs detected on your hosts and endpoints.

#### Applications

{% columns %}
{% column %}

<figure><img src="https://2423388680-files.gitbook.io/~/files/v0/b/gitbook-x-prod.appspot.com/o/spaces%2FV7OrHgKXA0t1jankQBYf%2Fuploads%2FfW9offTQh2YQh3WHKVPD%2FEnginsight-EN-Dashboard-Overview-Vulnerabilities-Applications.jpg?alt=media&amp;token=10f36e21-6438-447b-ad14-32b7c4493101" alt=""><figcaption></figcaption></figure>
{% endcolumn %}

{% column %}
The pie chart provides an overview of the five software applications that are most frequently affected by vulnerabilities across all assets.
{% endcolumn %}
{% endcolumns %}

#### Tendency

The bar chart shows the total number of CVEs detected on your hosts and endpoints over a three-month period, grouped by severity. Each bar represents one day.

<figure><img src="https://2423388680-files.gitbook.io/~/files/v0/b/gitbook-x-prod.appspot.com/o/spaces%2FV7OrHgKXA0t1jankQBYf%2Fuploads%2FL5wrqAsdEehnk4rBOwTM%2FEnginsight-EN-Dashboard-Overview-Vulnerabilities-Tendency.jpg?alt=media&amp;token=1547868c-7abb-45b6-98af-b1969e37af0d" alt=""><figcaption></figcaption></figure>

The following severity levels are shown:

* **Critical**: The vulnerability has a very high criticality.
* **High**: The vulnerability has a high criticality.
* **Medium**: The vulnerability has a medium criticality.
* **Low**: The vulnerability has a low criticality.

#### Scatterplot

The scatter plot compares individual assets (hosts and endpoints) based on the risk score calculated by Enginsight and the number of detected vulnerabilities.

<div align="left"><figure><img src="https://2423388680-files.gitbook.io/~/files/v0/b/gitbook-x-prod.appspot.com/o/spaces%2FV7OrHgKXA0t1jankQBYf%2Fuploads%2FrN8C2s8TPg1K9No4Raj3%2FEnginsight-EN-Dashboard-Overview-Vulnerabilities-Scatterplot.jpg?alt=media&amp;token=732015f0-eb6a-4eb8-8223-6d67f35c54a8" alt="" width="494"><figcaption></figcaption></figure></div>

Each point represents one asset. The further to the right and higher a point appears on the chart, the higher its risk score and the greater the number of vulnerabilities detected. The [color of each point](https://docs.enginsight.com/docs/manual/english/appendix/color-coding-of-severity-levels.md) indicates the severity of the respective asset.

<i class="fa-computer-mouse">:computer-mouse:</i> Hover over a point to show details such as the asset name, calculated risk score, and total number of detected vulnerabilities for that asset.

#### Risk Score

The table shows up to 20 assets that are considered most at risk based on the risk score calculated by Enginsight.

{% hint style="info" %}
The table is sorted in descending order by asset risk level.
{% endhint %}

{% hint style="success" icon="lightbulb" %}
For more information on how the Enginsight-specific risk score is calculated, see our Knowledge Base: [How is Enginsight's own risk score calculated?](https://docs.enginsight.com/docs/knowledge-base/english/risk-scores/how-is-enginsights-own-risk-score-calculated)
{% endhint %}

<div align="left"><figure><img src="https://2423388680-files.gitbook.io/~/files/v0/b/gitbook-x-prod.appspot.com/o/spaces%2FV7OrHgKXA0t1jankQBYf%2Fuploads%2FQ51xesPQBt900cSJT20y%2FEnginsight-EN-Dashboard-Overview-Vulnerabilities-Risk%20Score.jpg?alt=media&amp;token=d5f12df4-444c-432e-ac52-ca103b34338d" alt="" width="494"><figcaption></figcaption></figure></div>

The following information is shown:

<table><thead><tr><th width="200.05859375">Column</th><th>Description</th></tr></thead><tbody><tr><td>Reference</td><td>Shows the name of the affected host or endpoint.<br><br><i class="fa-computer-mouse">:computer-mouse:</i> Click a list entry to navigate to the respective <a href="https://docs.enginsight.com/docs/manual/english/platform-usage/host-detail-view.md">host detail view</a> or <a href="https://docs.enginsight.com/docs/manual/english/platform-usage/endpoint-detail-view.md">endpoint detail view</a>.</td></tr><tr><td>Vulnerabilities</td><td>Shows the number of CVEs detected on the respective asset.</td></tr><tr><td>Risk Score</td><td>Shows the risk score calculated by Enginsight for the respective asset.</td></tr><tr><td>Visualized Risk Score</td><td>Shows a bar visualizing the risk score. The <a href="https://docs.enginsight.com/docs/manual/english/appendix/color-coding-of-severity-levels.md">color of the bar</a> indicates the severity of the respective asset.</td></tr></tbody></table>

***

### Network Anomalies

The tiles in this section show various analyses of attacks detected through network traffic analysis across all assets.

#### Attacks

{% columns %}
{% column %}

<figure><img src="https://2423388680-files.gitbook.io/~/files/v0/b/gitbook-x-prod.appspot.com/o/spaces%2FV7OrHgKXA0t1jankQBYf%2Fuploads%2FtGHiJ8xGCFK0WgoaAAe3%2FEnginsight-EN-Dashboard-Overview-Network%20Anomalies-Attacks.jpg?alt=media&amp;token=182593b4-4cb8-4218-8135-61ad07f04b1c" alt=""><figcaption></figcaption></figure>
{% endcolumn %}

{% column %}
The pie chart provides an overview of the five most frequently detected network attacks across all monitored assets.

The chart also shows how often each attack type was detected.
{% endcolumn %}
{% endcolumns %}

#### Attackers

{% columns %}
{% column %}

<figure><img src="https://2423388680-files.gitbook.io/~/files/v0/b/gitbook-x-prod.appspot.com/o/spaces%2FV7OrHgKXA0t1jankQBYf%2Fuploads%2FVDRgPUGolNimy8HlNdVC%2FEnginsight-EN-Dashboard-Overview-Network%20Anomalies-Attackers.jpg?alt=media&amp;token=dd2797fc-3ee0-47d4-bfdc-e4ead59e218e" alt=""><figcaption></figcaption></figure>
{% endcolumn %}

{% column %}
The pie chart provides an overview of the five source IP addresses responsible for the highest number of attacks against monitored assets.

The chart also shows the number of attacks originating from each source IP address.
{% endcolumn %}
{% endcolumns %}

#### Network Anomalies per Day

The bar chart shows the number of detected network anomalies over a three-month period, grouped by severity, as well as the number of blocked connections. Each bar represents one day.

<figure><img src="https://2423388680-files.gitbook.io/~/files/v0/b/gitbook-x-prod.appspot.com/o/spaces%2FV7OrHgKXA0t1jankQBYf%2Fuploads%2FuC8Syy79fbgLBcC7F6fj%2FEnginsight-EN-Dashboard-Overview-Network%20Anomalies-Anomalies%20per%20Day.jpg?alt=media&amp;token=339b4648-9da1-4257-9401-f36e58a154ec" alt=""><figcaption></figcaption></figure>

The following severity levels are shown:

* **High**: The network anomaly has a high criticality.
* **Medium**: The network anomaly has a medium criticality.
* **Low**: The network anomaly has a low criticality.
* **Blocked**: The connection from which the network attack originated was blocked.

***

### Audits

The tiles in this section show various analyses of the results of penetration tests performed on your target systems.

#### Risk Score

{% columns %}
{% column %}

<figure><img src="https://2423388680-files.gitbook.io/~/files/v0/b/gitbook-x-prod.appspot.com/o/spaces%2FV7OrHgKXA0t1jankQBYf%2Fuploads%2FiySAMMIZUX5gBSBkCH9u%2FEnginsight-EN-Dashboard-Overview-Risk%20Score.jpg?alt=media&amp;token=02a951b5-110b-478a-a071-f80e75963d40" alt=""><figcaption></figcaption></figure>
{% endcolumn %}

{% column %}
The pie chart provides an overview of the five target systems with the highest calculated risk scores across all executed penetration tests.

{% hint style="success" icon="lightbulb" %}
For more information on how the Enginsight-specific risk score is calculated, see our Knowledge Base: [How is Enginsight's own risk score calculated?](https://docs.enginsight.com/docs/knowledge-base/english/risk-scores/how-is-enginsights-own-risk-score-calculated)
{% endhint %}

The aggregated risk score calculated by Enginsight is shown for each target system.
{% endcolumn %}
{% endcolumns %}

#### Severity

{% columns %}
{% column width="41.66666666666667%" %}

<figure><img src="https://2423388680-files.gitbook.io/~/files/v0/b/gitbook-x-prod.appspot.com/o/spaces%2FV7OrHgKXA0t1jankQBYf%2Fuploads%2F7I6oAojCf8KTCwmgFnfS%2FEnginsight-EN-Dashboard-Overview-Assets-Severity.jpg?alt=media&amp;token=2dfb8bc3-1979-46bf-a757-394a6973eaf5" alt=""><figcaption></figcaption></figure>
{% endcolumn %}

{% column width="58.33333333333333%" %}
The pie chart shows the number of findings from all executed checks, grouped by severity.

The following severity levels are shown:

* **Criticals**: The number of checks with a very high criticality.
* **Highs**: The number of checks with a high criticality.
* **Mediums**: The number of checks with a medium criticality.
* **Lows**: The number of checks with a low criticality.
* **Oks**: The number of checks that were passed.
  {% endcolumn %}
  {% endcolumns %}

#### Tendency

The bar chart shows the number of findings generated by executed checks over a three-month period, grouped by severity. Each bar represents one day.

<figure><img src="https://2423388680-files.gitbook.io/~/files/v0/b/gitbook-x-prod.appspot.com/o/spaces%2FV7OrHgKXA0t1jankQBYf%2Fuploads%2FcTCONKpmwIMQjJkJKTtz%2FEnginsight-EN-Dashboard-Overview-Assets-Tendency.jpg?alt=media&amp;token=876228c6-f692-41da-ab62-4534d0e371e3" alt=""><figcaption></figcaption></figure>

The following severity levels are shown:

* **Criticals**: The number of checks with a very high criticality.
* **Highs**: The number of checks with a high criticality.
* **Mediums**: The number of checks with a medium criticality.
* **Lows**: The number of checks with a low criticality.
* **Oks**: The number of checks that were passed.
* **Error**: The penetration test was terminated.

***

## Further Resources

**Knowledge Base**

* [How is Enginsight's own risk score calculated?](https://docs.enginsight.com/docs/knowledge-base/english/risk-scores/how-is-enginsights-own-risk-score-calculated)

***
